The global mean water level in the ocean rose by 0.14 inches (3.6
millimeters) per year from 2006–2015, which was 2.5 times the average
rate of 0.06 inches (1.4 millimeters) per year throughout most of the
twentieth century. By the end of the century, global mean sea level is
likely to rise at least one foot (0.3 meters) above 2000 levels, even if
greenhouse gas emissions follow a relatively low pathway in coming
decades.
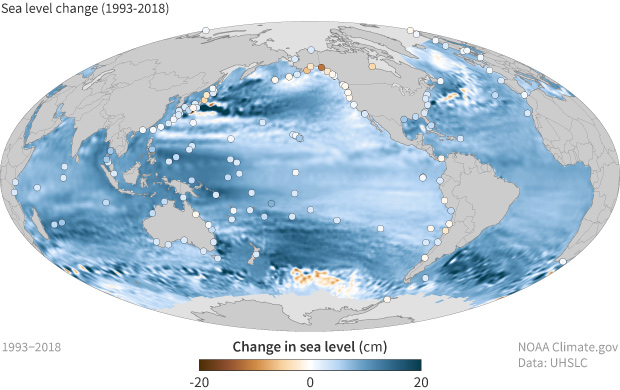
In some ocean basins, sea level rise has been as much as 6-8 inches
(15-20 centimeters) since the start of the satellite record. Regional
differences exist because of natural variability in the strength of
winds and ocean currents, which influence how much and where the deeper
layers of the ocean store heat."
..........................
ADMIN: The above figures are now seen by some scientists as an underestimation of sea level rise. See article below.
Greenland shed ice at unprecedented rate in 2019; Antarctica continues to lose mass: EurekAlert
....................................

Between 1993 and 2018, mean sea level has risen across most of the world ocean (blue colors). In some ocean basins, sea level has risen 6-8 inches (15-20 centimeters). Rates of local sea level (dots) can be amplified by geological processes like ground settling or offset by processes like the centuries-long rebound of land masses from the loss of ice age glaciers. NOAA Climate.gov map, based on data provided by Philip Thompson, University of Hawaii.
Past and future sea level rise at specific locations on
land may be more or less than the global average due to local factors:
ground settling, upstream flood control, erosion, regional ocean
currents, and whether the land is still rebounding from the compressive
weight of Ice Age glaciers. In the United States, the fastest rates of
sea level rise are occurring in the Gulf of Mexico from the mouth of the
Mississippi westward, followed by the mid-Atlantic. Only in Alaska and a
few places in the Pacific Northwest are sea levels falling, though that
trend will reverse under high greenhouse gas emission pathways.
In some ocean basins, sea level rise
has been as much as 6-8 inches (15-20 centimeters) since the start of
the satellite record in 1993.
Why sea level matters
In the United States, almost 40 percent
of the population lives in relatively high population-density coastal
areas, where sea level plays a role in flooding, shoreline erosion, and
hazards from storms. Globally, 8 of the world’s 10 largest cities are
near a coast, according to the U.N. Atlas of the Oceans.
In urban settings along coastlines around the world, rising seas threaten infrastructure necessary for local jobs and regional industries. Roads, bridges, subways, water supplies, oil and gas wells, power plants, sewage treatment plants, landfills—the list is practically endless—are all at risk from sea level rise.
Higher background water levels mean that deadly and destructive storm
surges, such as those associated with Hurricane Katrina, “Superstorm”
Sandy, and Hurricane Michael—push farther inland than they once did.
Higher sea level also means more frequent high-tide flooding, sometimes
called “nuisance flooding”
because it isn't generally deadly or dangerous, but it can be
disruptive and expensive. (Explore past and future frequency of
high-tide flooding at U.S. locations with the Climate Explorer, part of the U.S. Climate Resilience Toolkit.)

Nuisance flooding in Annapolis in 2012. Around the U.S., nuisance flooding has increased dramatically in the past 50 years. Photo by Amy McGovern.
In the natural world, rising sea level creates stress
on coastal ecosystems that provide recreation, protection from storms,
and habitat for fish and wildlife, including commercially valuable
fisheries. As seas rise, saltwater is also contaminating freshwater aquifers, many of which sustain municipal and agricultural water supplies and natural ecosystems.
Go to the original NOAA article by
Other 2019 reports of ice melt predict a higher sea rise. See below.
Read the complete original Inside Climate News article
 |
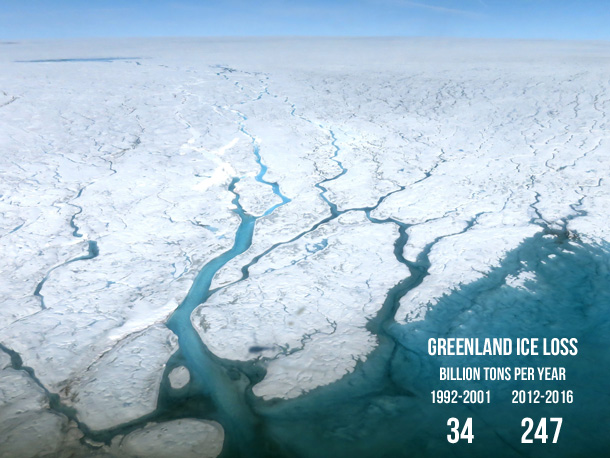
| Melt streams on the Greenland Ice Sheet on July 19, 2015. Ice loss from the Greenland and Antarctic Ice Sheets as well as alpine glaciers has accelerated in recent decades. NASA photo by Maria-José Viñas. |
Go to the original NOAA article by
November 19, 2019
Other 2019 reports of ice melt predict a higher sea rise. See below.
Greenland shed ice at unprecedented rate in 2019; Antarctica continues to lose mass: EurekAlert
' "It is very likely that the current climate models overestimate the meltwater retention capacity of the ice sheet and underestimate the projected sea level rise coming from Greenland ... by a factor of two or three," he said. ' ICNewsRead the complete original Inside Climate News article

No comments:
Post a Comment