Showing posts with label sea level rise. Show all posts

Monday, 28 February 2022

Will predicted sea rise inundation and flooding affect property values in Coffs Harbour NSW?

#inundation  #sea rise  #searise  #climatecrisis  #climatechange  #ice  #melting ice
Coffs Harbour 7m rise. Click to enlarge.
As many homes in Coffs Harbour  are flooded because of an intense rain depression we need also to examine the affect of sea rise. 
 
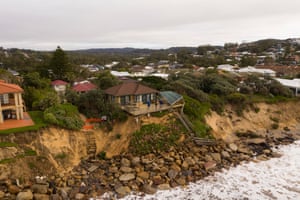
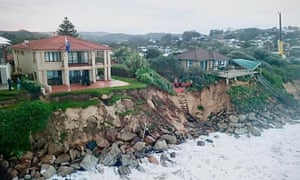
We also must stop building in flood affected areas. Councils must stop approving development in flood affected areas. It is ridiculous to see new buildings flooded to their roofs. Insurance companies may pay for a while but not without future higher payment rates. In the end every taxpayer pays.
 
• We are looking more and more unlikely to prevent severe global heating.

• Scientists are predicting the melting of the ice covering Greenland with a subsequent sea level rise of 7m.

• This rise does not factor in sea rise from the melting of Antarctica and other ice.

• Already many properties are likely to flood when a high tide is combined with high local rainfall. What were a hundred year rainfall events are now ten year events.

• The frequency of high rainfall events will increase with global heating and more and more severe hurricanes are predicted because of warmer seas.

• Low coastal areas will be subjected to severe storm surges.

• Would you buy a property likely to be inundated in twenty years, fifty years, a hundred years? Many wouldn't. Even the perception of possible inundation will greatly affect property values.

• When certain properties are in less demand their value falls.

• Would you buy a property with a value likely to fall?

•  The view of Coffs Harbour above shows areas likely to be inundated by a 7m sea level rise.

• Property above a 10m rise will become highly sought after and will greatly rise in value.

Learn more about how sea rise inundation will affect Australian property.

Click here to go to Coastal Risk Australia site

'Retreat' Is Not An Option As A California Beach Town Plans For Rising Seas: NPR 


#inundation  #sea rise  #searise  #climatecrisis  #climatechange  #ice  #melting ice 

Thursday, 22 July 2021

Excerpt: 10 cities most affected by rising sea levels, Two Indian cities in the list


 "Ground Report | New Delhi: 10 cities most affected by rising sea levels; Climate change has numerous consequences on the daily lives of many people, but few are as palpable as rising sea levels. Many coastal communities around the world already live with the permanent threat of floods, which, driven by the melting of glaciers and polar ice caps, drown entire neighborhoods, putting people’s lives at risk and causing economic havoc. And what is worse, if the world does not meet the objectives of the Paris Agreement and limits the increase in the global average temperature to 1.5 ° C by 2050, many of the cities of the planet will see this extraordinary threat multiplied.

In just three decades, more than 570 coastal cities will face a projected rise in sea level of at least 0.5 meters, putting more than 800 million people at risk, according to data collected by the C40, which brings together a network of cities in the world committed to ecological transition. Especially since, as that water level rises, the storms will become increasingly virulent. In fact, the increase in extreme weather events such as hurricanes or cyclones is a reality that breaks records every year and has a significant social and economic impact.

According to the UCCRN, a research network that brings together climate scientists from around the world, the economic costs to cities from rising sea levels and flooding could reach a trillion dollars each year by mid-century, the equivalent to the annual Spanish GDP. An estimate that they also estimate conservative, since, for example, Hurricane Sandy in 2012 alone damaged 90,000 buildings in New York, causing 19,000 million dollars in repairs."

Go to original GR article

Wednesday, 2 December 2020

Beating Back the Tides (excerpt) : NASA

High-tide floodwaters in downtown Annapolis on April 4, 2017. Credit: City of Annapolis
 "It was a sight you don’t normally see: a jellyfish lying dead in the middle of a parking lot partly submerged in water. But this was no ordinary parking lot. This particular section of asphalt in downtown Annapolis, Maryland, is among a growing number of areas prone to frequent flooding in the seaside town. The jellyfish had slipped in from the Chesapeake Bay through an opening in the seawall.

“You can literally kayak from the bay right into this parking lot,” said NOAA oceanographer William Sweet on the September day that we visited. The tide was relatively low that day.

On days with the highest tides of the year, whole parking lots and streets in Annapolis are underwater, causing delays and traffic congestion. Compromise Street, a major road into town, is often forced to shut down, slowing response times for firefighters and other first responders. Local businesses have lost as much as $172,000 a year, or 1.4% of their annual revenue, due to high-tide floods, according to a study published in 2019 in the journal Science Advances.

High-tide floods, also known as nuisance floods, sunny-day floods, and recurrent tidal floods, occur “when tides reach anywhere from 1.75 to 2 feet above the daily average high tide and start spilling onto streets or bubbling up from storm drains,” according to an annual report on the subject by the National Oceanic and Atmospheric Administration (NOAA.) These floods are usually not related to storms; they typically occur during high tides, and they impact people’s lives. Because of rising seas driven by climate change, the frequency of this kind of flood has dramatically increased in recent years.".... By Jenny Marder,
NASA's Goddard Space Flight Center

Go to complete NASA article

Sunday, 25 October 2020

The Arctic is in a death spiral. How much longer will it exist? (excerpt): The Guardian


 "The region is unravelling faster than anyone could once have predicted. But there may still be time to act."


At the end of July, 40% of the 4,000-year-old Milne Ice Shelf, located on the north-western edge of Ellesmere Island, calved into the sea. Canada’s last fully intact ice shelf was no more.

On the other side of the island, the most northerly in Canada, the St Patrick’s Bay ice caps completely disappeared.

Two weeks later, scientists concluded that the Greenland Ice Sheet may have already passed the point of no return. Annual snowfall is no longer enough to replenish the snow and ice loss during summer melting of the territory’s 234 glaciers. Last year, the ice sheet lost a record amount of ice, equivalent to 1 million metric tons every minute.

The Arctic is unravelling. And it’s happening faster than anyone could have imagined just a few decades ago. Northern Siberia and the Canadian Arctic are now warming three times faster than the rest of the world. In the past decade, Arctic temperatures have increased by nearly 1C. If greenhouse gas emissions stay on the same trajectory, we can expect the north to have warmed by 4C year-round by the middle of the century."

Go to Guardian article and photo essay


Related:  Vigorous action needed, and soon, on climate change (excerpt): Yale Climate Connections


Arctic,Antarctica,Greenland ice melt,#icemelting,sea level rise,#climate crisis,

Friday, 16 October 2020

Florida Sees Signals of a Climate-Driven Housing Crisis (excerpt): NYT

"Home sales in areas most vulnerable to sea-level rise began falling around 2013, researchers found. Now, prices are following a similar downward path."

In Florida, home sales in areas at high risk from sea-level rise

have fallen compared to areas at low risk.


"The idea that climate change will eventually ruin the value of coastal homes is neither new nor particularly controversial. In 2016, the then-chief economist for the federal mortgage giant Freddie Mac warned that rising seas “appear likely to destroy billions of dollars in property and to displace millions of people.” By 2045, more than 300,000 existing coastal homes will be at risk of flooding regularly, the Union of Concerned Scientists concluded in 2018.

The question that has occupied researchers is how soon, and how quickly, people will respond to that risk by demanding price discounts or fleeing the market. Previous research has begun to tackle that question, showing that climate change, far from being a distant threat, is already starting to hurt real estate values."


Credit...Rose Marie Cromwell for The New York Times

"Then, starting in 2013, something started to change. While sales in safer areas kept climbing, sales in vulnerable ones began to fall. By 2018, the last year for which Dr. Keys and Mr. Mulder obtained data, sales in vulnerable areas trailed safer areas by 16 percent to 20 percent.

A few things happened around that time that might have made prospective home buyers more worried about climate risk, Dr. Keys said. An international report the previous year highlighted the risks of extreme weather events. After that report came out, Google searches in Florida for “sea level rise” spiked.

And people from the Northeast, who account for a significant portion of Florida home buyers, had just lived through Hurricane Sandy, which damaged some 650,000 homes and caused 8.5 million people to lose power, some for months."


Go to NYT original full length story 


Related: I’m an American Climate Emigrant (excerpts): Sierra


Tuesday, 1 September 2020

Sea level rise from ice sheets track worst-case climate change scenario: Phys.org

Credit: CC0 Public Domain 
Ice sheets in Greenland and Antarctica whose melting rates are rapidly increasing have raised the global sea level by 1.8cm since the 1990s, and are matching the Intergovernmental Panel on Climate Change's worst-case climate warming scenarios.
According to a new study from the University of Leeds and the Danish Meteorological Institute, if these rates continue, the ice sheets are expected to raise sea levels by a further 17cm and expose an additional 16 million people to annual coastal flooding by the end of the century.

Since the ice sheets were first monitored by satellite in the 1990s, melting from Antarctica has pushed global sea levels up by 7.2mm, while Greenland has contributed 10.6mm. And the latest measurements show that the world's oceans are now rising by 4mm each year.

"Although we anticipated the ice sheets would lose increasing amounts of ice in response to the warming of the oceans and atmosphere, the rate at which they are melting has accelerated faster than we could have imagined," said Dr. Tom Slater, lead author of the study and climate researcher at the Centre for Polar Observation and Modelling at the University of Leeds.

"The melting is overtaking the we use to guide us, and we are in danger of being unprepared for the risks posed by rise."

Wednesday, 19 August 2020

Sea level rise is so much more than melting ice: Verge Science video


While researching climate change, we heard something confusing: the sea level in New York City is rising about one and a half times faster than the global average. We couldn’t figure out what that meant. Isn’t the sea level...flat? So we called up an expert, Dr. Andrea Dutton, and went down the rabbit hole. And, we did our best to visualize her truly bizarre answers with animations, dioramas, and a lot of melting ice.

Subscribe: http://bit.ly/2FqJZMl

Related:Greenland's melting ice sheet has passed the point of no return, scientists say (excerpt): USA Today


sea level rise, #searise, #climatechange, #cambio-climatico, #icemelting, #jailclimatecriminals,  

Friday, 14 August 2020

Sea Level Rise Effect on Mumbai of 1.5m rise

Mumbai, land at risk from 1.5m sea rise
 • We are looking more and more unlikely to prevent global heating.

• Scientists are predicting the melting of the ice covering Greenland with a subsequent sea level rise of 7m.

• This rise does not factor in sea rise from the melting of Antarctica and other ice.

• Already many properties are likely to flood when a high tide is combined with high local rainfall. 
 

What were a hundred year rainfall events are now ten year events.


Mumbai, land at risk with 1.0m sea rise
 
• The frequency of high rainfall events will increase with global heating and more and more severe hurricanes are predicted because of warmer seas.


• Low coastal areas will be subjected to severe storm surges.

• Would you buy a property likely to be inundated in twenty years, fifty years, a hundred years? Many wouldn't. Even the perception of possible inundation will greatly affect property values. Some properties will become more expensive to insure or become impossible to insure

• When certain properties are in less demand their value falls.

• Would you buy a property with a value that is likely to fall?

•  The view of Mumbai above shows areas likely to be inundated by a 1.5m and a 1.0m sea level rise.

• Property above a 10m rise will become highly sought after and will greatly increase in value.

Learn more about how sea rise inundation will affect India's property, indeed any property, at climatecentral.org


Related:

Greenland shed ice at unprecedented rate in 2019; Antarctica continues to lose mass: EurekAlert


Melbourne: predicted flooding with a conservative sea level rise of only 1.5m


#sea level rise, #Greenland ice melt, #sea ice, #climateaction, #climatechange, #jailclimatecriminals, #cambio-climatico,  

Friday, 24 July 2020

Insuring your home may get harder and more expensive as climate change increases risks: ABC


Climate change, #jailclimatecriminals
Threatened by rising sea level
"Our homes have become sanctuaries — places of refuge in the time of coronavirus. But they can't protect us from all threats.


Analysts say the houses we've built, and where we've built them, could increase our future vulnerability as we face the ongoing effects of climate change.

Destroyed units  #jailclimatecriminals
Analysts fear insurers may withdraw
 from areas they don't believe
 are profitable.(ABC News: Tim Swanston)
With increased damage to houses through catastrophic fires, floods and other disasters, the global insurance market is under increasing stress, and there are fears whole communities could become impoverished or homeless.

Experts doubt industry players and governments have fully come to terms with the issue — and they worry about some of the financial mechanisms insurance companies have put in place to share the risk.

Too focused on past catastrophes

Insurers have a short-term focus and often fail to be proactive in assessing future problems, according to Jason Thistlethwaite, a Canada-based academic and expert on insurance practice.

He says while global climate models are forward looking, the actuarial practices used for risk modelling in the insurance industry are not.

Put bluntly, insurers still spend most of their time looking in the rear-view mirror.

Sandbags and temporary fencing stretch down a beach at the base of a large, eroded sand dunes.
Erosion could cost some homeowners their entire asset, experts warn.(ABC RN: Antony Funnell)

Where there has been a shift in attitude, though, is among "reinsurers" — essentially, the insurance companies for insurance companies.


"Reinsurers are starting to grasp that these extreme events are something known as correlated risk, meaning that there is a common cause underlying them," Professor Thistlethwaite says.

"So, Australia may have a good year with very few claims in the primary insurance market, but reinsurance rates may still go up because there is bad flooding in the Philippines or the United Kingdom, for instance.

"They are operating at a global scale that allows them to pick up on data points that provide a much more coherent pattern that shows extreme weather events are getting worse and contributing to higher losses."

He says that broader, interconnected understanding of risk is starting to filter down to primary insurers, as they themselves experience increasing reinsurance costs.

Nevertheless, he's predicting a rationalisation of the primary insurance market, with some companies going bust and others simply withdrawing from areas they don't believe profitable.

Rise of the 'red zones of risk'

Professor Thistlethwaite says it's already happening in the United States in regions regularly affected by major climate-related events, such as hurricanes and tornados.

And it's also beginning to occur in Australia, according to Karl Mallon, director of science at the organisation Climate Risk.

"If we see emissions continuing in the current direction, the level of warming continuing in the same direction, and if we continue to see a sort of blind attitude to what's happening, then our risk will rise to about one in 10 properties," he says.

"Ninety per cent of properties may be OK, as in they are still insurable, even though the costs might be elevated. [But] one in 10 may really cross into the red zone territory."

Early last year the Insurance Council of Australia accused Dr Mallon of "scaremongering", but its president Richard Enthoven has since acknowledged that changing weather systems could potentially make some parts of Australia "uninsurable".

Dr Mallon cites parts of the Gold Coast in Queensland, the Central Coast in New South Wales, and West Lakes in South Australia as regions facing an impending crisis.

Legal expert Justine Bell-James warns that coastal communities could face a double hit: not only could their houses become uninsurable, but some homeowners could lose their entire asset due to erosion."


A huge percentage of homes may become uninsurable.
The eroding sea at Wamberal NSW.


Monday, 20 July 2020

Climate Change: Global Sea Level: NOAA

South Beach, Miami on May 3, 2007. Photo by Flickr user James WIlliamor, via a Creative Commons license.


"Sea level since 1880

The global mean water level in the ocean rose by 0.14 inches (3.6 millimeters) per year from 2006–2015, which was 2.5 times the average rate of 0.06 inches (1.4 millimeters) per year throughout most of the twentieth century. By the end of the century, global mean sea level is likely to rise at least one foot (0.3 meters) above 2000 levels, even if greenhouse gas emissions follow a relatively low pathway in coming decades.

In some ocean basins, sea level rise has been as much as 6-8 inches (15-20 centimeters) since the start of the satellite record. Regional differences exist because of natural variability in the strength of winds and ocean currents, which influence how much and where the deeper layers of the ocean store heat."

..........................

ADMIN: The above figures are now seen by some scientists as an underestimation of sea level rise. See article below.

Greenland shed ice at unprecedented rate in 2019; Antarctica continues to lose mass: EurekAlert


....................................


Global map of mean sea level change since 1993 with dots showing local sea level change on land


Between 1993 and 2018, mean sea level has risen across most of the world ocean (blue colors). In some ocean basins, sea level has risen 6-8 inches (15-20 centimeters). Rates of local sea level (dots) can be amplified by geological processes like ground settling or offset by processes like the centuries-long rebound of land masses from the loss of ice age glaciers. NOAA Climate.gov map, based on data provided by Philip Thompson, University of Hawaii. 
Past and future sea level rise at specific locations on land may be more or less than the global average due to local factors: ground settling, upstream flood control, erosion, regional ocean currents, and whether the land is still rebounding from the compressive weight of Ice Age glaciers. In the United States, the fastest rates of sea level rise are occurring in the Gulf of Mexico from the mouth of the Mississippi westward, followed by the mid-Atlantic. Only in Alaska and a few places in the Pacific Northwest are sea levels falling, though that trend will reverse under high greenhouse gas emission pathways.

In some ocean basins, sea level rise has been as much as 6-8 inches (15-20 centimeters) since the start of the satellite record in 1993.

Why sea level matters

In the United States, almost 40 percent of the population lives in relatively high population-density coastal areas, where sea level plays a role in flooding, shoreline erosion, and hazards from storms. Globally, 8 of the world’s 10 largest cities are near a coast, according to the U.N. Atlas of the Oceans.


In urban settings along coastlines around the world, rising seas threaten infrastructure necessary for local jobs and regional industries. Roads, bridges, subways, water supplies, oil and gas wells, power plants, sewage treatment plants, landfills—the list is practically endless—are all at risk from sea level rise. 

Higher background water levels mean that deadly and destructive storm surges, such as those associated with Hurricane Katrina, “Superstorm” Sandy, and Hurricane Michael—push farther inland than they once did. Higher sea level also means more frequent high-tide flooding, sometimes called “nuisance flooding” because it isn't generally deadly or dangerous, but it can be disruptive and expensive. (Explore past and future frequency of high-tide flooding at U.S. locations with the Climate Explorer, part of the U.S. Climate Resilience Toolkit.)


Nuisance flooding in Annapolis in 2012. Around the U.S., nuisance flooding has increased dramatically in the past 50 years. Photo by Amy McGovern.

In the natural world, rising sea level creates stress on coastal ecosystems that provide recreation, protection from storms, and habitat for fish and wildlife, including commercially valuable fisheries. As seas rise, saltwater is also contaminating freshwater aquifers, many of which sustain municipal and agricultural water supplies and natural ecosystems.


Photo of melt streams on the Greenland Ice Sheet in summer 2015
Melt streams on the Greenland Ice Sheet on July 19, 2015. Ice loss from the Greenland and Antarctic Ice Sheets as well as alpine glaciers has accelerated in recent decades. NASA photo by Maria-JosĂ© Viñas.

Go to the original NOAA article by

Author: 
November 19, 2019

Other 2019 reports of ice melt predict a higher sea rise. See below.

Greenland shed ice at unprecedented rate in 2019; Antarctica continues to lose mass: EurekAlert

 ' "It is very likely that the current climate models overestimate the meltwater retention capacity of the ice sheet and underestimate the projected sea level rise coming from Greenland ... by a factor of two or three," he said. ' ICNews

Read the complete original Inside Climate News article


Houston: predicted flooding with a conservative sea level rise of only 2ft.


Flooding of Houston with a 2ft sea rise
 • We are looking more and more unlikely to prevent global heating.

• Scientists are predicting the melting of the ice covering Greenland with a subsequent sea level rise of 23ft.

• This rise does not factor in sea rise from the melting of Antarctica and other ice.


• Already many properties are likely to flood when a high tide is combined with high local rainfall. 
 

Flooding of Houston with a  mere 1ft sea level rise


What were a hundred year rainfall events are now ten year events.


• The frequency of high rainfall events will increase with global heating and more and more severe hurricanes are predicted because of warmer seas.


Flooding of Houston with a 10ft sea rise

• Low coastal areas will be subjected to severe storm surges.

• Would you buy a property likely to be inundated in twenty years, fifty years, a hundred years? Many wouldn't. Even the perception of possible inundation will greatly affect property values.

• When certain properties are in less demand their value falls.

• Would you buy a property with a value that is likely to fall?

•  The view of Houston above shows areas likely to be inundated by a 10ft sea level rise.

• Property above a 20ft rise will become highly sought after and will greatly increase in value.

Learn more about how sea rise inundation will affect U.S. property on climate.gov


Related:

Greenland shed ice at unprecedented rate in 2019; Antarctica continues to lose mass: EurekAlert


Melbourne: predicted flooding with a conservative sea level rise of only 1.5m


#sea level rise, #Greenland ice melt, #sea ice, #climateaction, #climatechange, #jailclimatecriminals, #cambio-climatico,  

Saturday, 18 July 2020

Huge swells on NSW Central Coast leave Wamberal homes at risk of collapse due to beach erosion : The Guardian

Coastal erosion in the suburb of Wamberal on the Central Coast of NSW where homes are at risk of collapse after huge swells hit the state’s beaches on Thursday.
Coastal erosion in the suburb of Wamberal on the Central Coast of NSW where homes are at risk of collapse after huge swells hit the state’s beaches on Thursday. Photograph: James D Morgan/Getty Images

Several houses on Ocean View Drive now dangerously close to cliff edge as huge waves wash away beaches.

Houses on Ocean Drive in Wamberal
The worst-hit suburb was Wamberal, where large beachfront homes have been significantly damaged as the sandy soil they were built on was stripped away.
 
Comment by blog admin : As sea level rises and higher storm surges destroy more beachfront property the owners will lobby for unaffordable sea walls but ratepayers will resist. Coastal retreat will become the norm. Will you buy where sea rise and coastal surges will occur?

Read original complete The Guardian article  

Related:

Melbourne: predicted flooding with a conservative sea level rise of only 1.5m


 Related:


Wednesday, 15 July 2020

Climate Explained: What the World Was Like the Last Time Carbon Dioxide Levels Were at 400ppm: EW

a hotter planet
climate change
What was the climate and sea level like at times in Earth’s history when carbon dioxide in the atmosphere was at 400ppm? 


The last time global carbon dioxide levels were consistently at or above 400 parts per million (ppm) was around four million years ago during a geological period known as the Pliocene Era (between 5.3 million and 2.6 million years ago). The world was about 3℃ warmer and sea levels were higher than today.


We know how much carbon dioxide the atmosphere contained in the past by studying ice cores from Greenland and Antarctica. As compacted snow gradually changes to ice, it traps air in bubbles that contain samples of the atmosphere at the time. We can sample ice cores to reconstruct past concentrations of carbon dioxide, but this record only takes us back about a million years.


Beyond a million years, we don't have any direct measurements of the composition of ancient atmospheres, but we can use several methods to estimate past levels of carbon dioxide. One method uses the relationship between plant pores, known as stomata, that regulate gas exchange in and out of the plant. The density of these stomata is related to atmospheric carbon dioxide, and fossil plants are a good indicator of concentrations in the past.


Another technique is to examine sediment cores from the ocean floor. The sediments build up year after year as the bodies and shells of dead plankton and other organisms rain down on the seafloor. We can use isotopes (chemically identical atoms that differ only in atomic weight) of boron taken from the shells of the dead plankton to reconstruct changes in the acidity of seawater. From this we can work out the level of carbon dioxide in the ocean.
The data from four-million-year-old sediments suggest that carbon dioxide was at 400ppm back then.

Sea Levels and Changes in Antarctica 


During colder periods in Earth's history, ice caps and glaciers grow and sea levels drop. In the recent geological past, during the most recent ice age about 20,000 years ago, sea levels were at least 120 meters lower than they are today.


Sea-level changes are calculated from changes in isotopes of oxygen in the shells of marine organisms. For the Pliocene Era, research shows the sea-level change between cooler and warmer periods was around 30-40 meters and sea level was higher than today. Also during the Pliocene, we know the West Antarctic Ice Sheet was significantly smaller and global average temperatures were about 3℃ warmer than today. Summer temperatures in high northern latitudes were up to 14℃ warmer.


This may seem like a lot but modern observations show strong polar amplification of warming: a 1℃ increase at the equator may raise temperatures at the poles by 6-7℃. It is one of the reasons why Arctic sea ice is disappearing.

Impacts in New Zealand and Australia  


Read the complete EW article